Renders one panel per input matrix per requested view and returns them in a tibble rather than drawing to a device.
Usage
precise_viz(
  data,
  views = "heatmap",
  type = NULL,
  params = list(),
  diagnostics = NULL,
  agreement = NULL,
  parallel = FALSE,
  verbose = TRUE
)
Arguments
- data
A tabular object with
matrix,type, and either adistanceor amethodkey column, a named list of matrices withtype=, or one bare matrix withtype=. Unnamed list elements are keyedmatrix_<n>.- views
A character vector of unique view names. One row is returned per input matrix per view, except
agreement, which always contributes two.- type
Only for bare list or matrix input.
"distance"or"similarity". Must be omitted for tabular input, whosetypecolumn is authoritative.- params
A named list of per-view parameter lists keyed by view name, for example
params = list(heatmap = list(cluster = FALSE, engine = "plotly"))orparams = list(embedding = list(method = "umap", n_neighbors = 15, seed = 42)).- diagnostics
Optional data frame with a unique
distancekey and scalar columns, normally the output ofPreciseDist::precise_diagnostics(). Those columns are attached to each per-matrix panel by matchinginput, and become sortable cognostics inprecise_trellis().- agreement
Optional precomputed agreement result matching the matrices in
data, normally the output ofPreciseDist::precise_correlations(). Required whenviewscontains"agreement"and must beNULLotherwise. It needsstatisticandsignifmatrices and may carry aparameterslist.- parallel
TRUEorFALSE. Render panels on a registered foreach backend. Views are deterministic, so output is identical either way.- verbose
TRUEorFALSE. Report each panel as it renders.
Value
A tibble with one row per panel. The first columns are panel_id
(the display label input__view, which is never parsed back),
input, view, input_type, panel (the plot object or
widget), panel_class, data (the numbers that were plotted),
parameters, meta, and time_taken_seconds. Scalar provenance
columns from the input, such as metric or graph_method,
follow, and then any columns supplied through diagnostics=.
Details
Input type is declared rather than inferred. The function computes only the ordering, layout, or embedding coordinates required by a requested view; an incompatible view and input type are an error.
heatmap
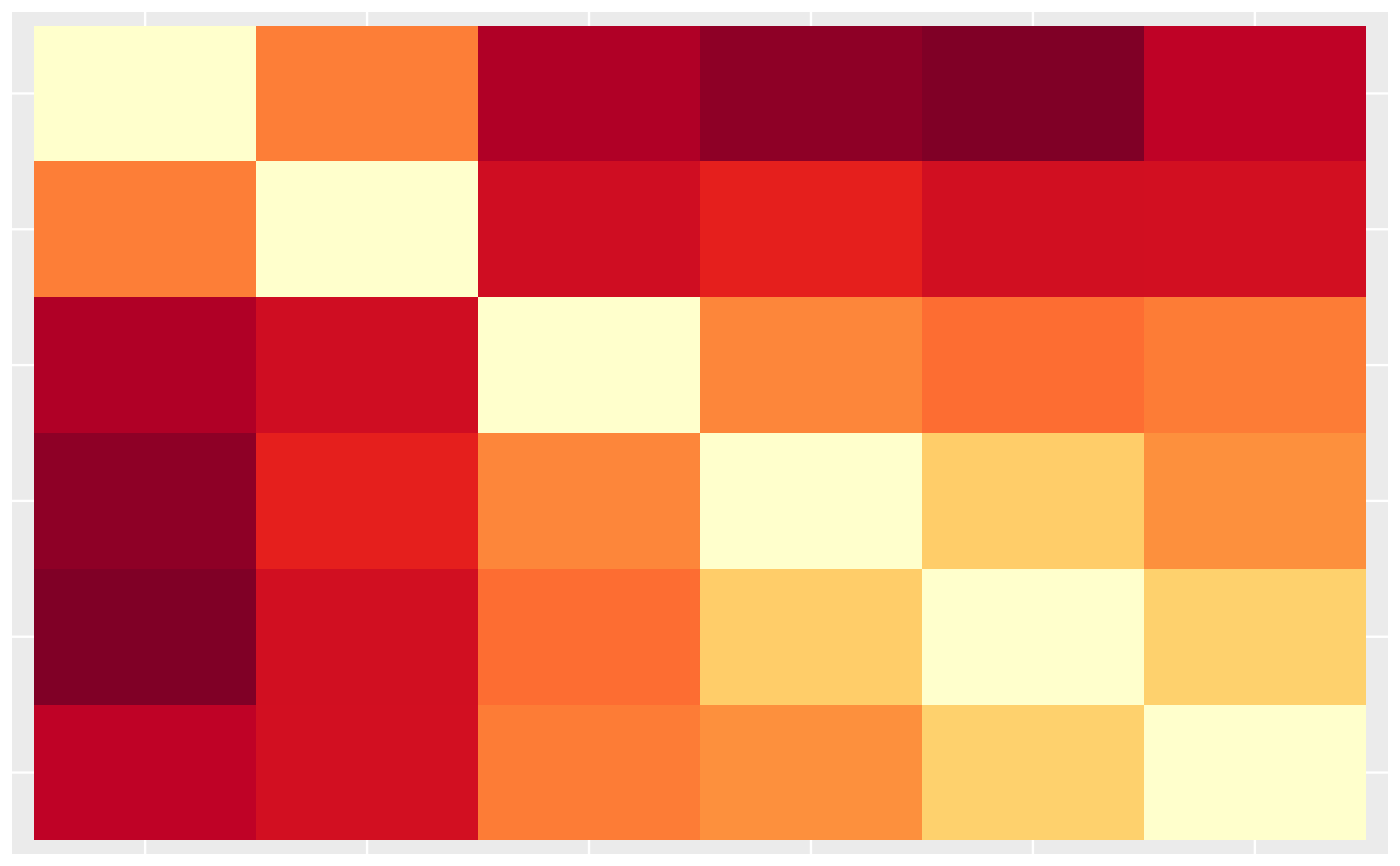
Accepts distance or similarity. A tile map of the matrix, ordered by
hierarchical clustering when cluster = TRUE (the default). method is
passed to stats::hclust() unchanged and is case-sensitive.
cluster = FALSE uses input order. engine is "ggplot2" (the default) or
"plotly". meta carries the cophenetic correlation.
embedding
Accepts distance only. method = "umap" (the default) uses uwot and
exposes n_neighbors, min_dist, and spread. method = "mds" uses
stats::cmdscale(). method = "tsne" requires the suggested Rtsne
package and exposes perplexity, theta, max_iter, eta,
exaggeration_factor, and check_duplicates, where perplexity = NULL
derives a value from the number of observations.
dimensions is 2 or 3. engine is "ggplot2" (2-D only), "plotly" (2-D
or 3-D), or "threejs" (3-D, requires the suggested threejs package).
color is a vector in row order or a named vector matched to observation
names, colors supplies a palette, show_labels prints observation names,
and size scales the plotted points on every engine.
graph_layout
Accepts similarity only. Layouts come from igraph and are "mds"
(the default), "kk", "fr", "drl", "nicely", "sphere", "gem",
"graphopt", "lgl", and "dh". "mds", "kk", and "sphere" are
deterministic and the rest use seed.
dimensions is 2 or 3, and layouts igraph offers only in 2-D are rendered
flat at z = 0 with meta$flat_3d set. render = "graph" draws edges and
render = "scatter" draws vertices only. engine is "ggplot2" (2-D),
"plotly" (2-D or 3-D), or "threejs" (3-D). interactive = TRUE returns a
2-D visNetwork widget and requires the suggested visNetwork package.
color, colors, show_labels, and size annotate vertices exactly as
they annotate points in embedding.
agreement
A collection view that renders the precomputed agreement= object as exactly
two rows, a statistic heatmap and a significance heatmap sharing one
clustered ordering. engine is "ggplot2" (the default) or "plotly".
meta reports the p-value floor implied by the recorded permutation count.
Reproducibility
Graph layouts and embeddings use seed = 42 unless another value is given,
and the session random-number state is restored before returning.
References
McInnes L, Healy J, Melville J (2018). UMAP: uniform manifold approximation and projection for dimension reduction. doi:10.48550/arXiv.1802.03426 .
van der Maaten L (2014). Accelerating t-SNE using tree-based algorithms. Journal of Machine Learning Research, 15, 3221–3245.
Csardi G, Nepusz T (2006). The igraph software package for complex network research. InterJournal Complex Systems, 1695.
Examples
data(data_cell_cycle, package = "PreciseViz")

cells <- c(1:4, 60:63, 118:121)
cell_cycle <- as.matrix(data_cell_cycle[cells, 2:41])
rownames(cell_cycle) <- paste0(data_cell_cycle$Cell_cycle[cells], "_", cells)
typed <- tibble::tibble(
  distance = "euclidean",
  matrix = list(as.matrix(stats::dist(cell_cycle))),
  type = "distance"
)

panels <- precise_viz(
  typed,
  views = "heatmap",
  params = list(heatmap = list(cluster = TRUE, method = "complete")),
  verbose = FALSE
)

panels[, c("panel_id", "input", "view", "input_type", "panel_class")]
#> # A tibble: 1 × 5
#>   panel_id           input     view    input_type panel_class
#>   <chr>              <chr>     <chr>   <chr>      <chr>
#> 1 euclidean__heatmap euclidean heatmap distance   ggplot2::ggplot
panels$panel[[1]]