PreciseViz draws distance and similarity matrices. You give it a matrix and say what the matrix is, and it gives back a plot object. That is the whole idea, and the discipline is in what it refuses to do.
It does not compute distances. It does not convert a similarity into a distance so that an embedding will accept it. It does not fuse matrices, build graphs, or calculate agreement. And it never decides from the numbers whether a matrix is a distance or a similarity, because that guess is exactly the kind of thing that quietly inverts a graph and makes the picture look better than the data.
The only numbers it computes are the ones a view needs to draw itself: a dendrogram ordering for a heatmap, layout coordinates for a graph, embedding coordinates for an embedding.
Three functions
-
precise_viz()rendersheatmap,embedding,graph_layout, andagreementviews. It returns one row per panel rather than drawing to a device, so forty panels are as easy to build as one. -
precise_trellis()turns that tibble into a Trelliscope display, keeping any diagnostics attached to the panels as values you can sort and filter on. -
precise_graphml()writes a graph out for Gephi and similar tools.
A quick example
Input is a data frame with a matrix list-column and a type column. Anything that produces relatedness matrices can supply it. Here it is built with base R from the cell-cycle data bundled with the package.
library(PreciseViz)

data(data_cell_cycle, package = "PreciseViz")

# The bundled cells are stored in label order, so take four from each block.
cells <- c(1:4, 60:63, 118:121)
cell_cycle <- as.matrix(data_cell_cycle[cells, 2:41])
rownames(cell_cycle) <- paste0(data_cell_cycle$Cell_cycle[cells], "_", cells)
groups <- stats::setNames(data_cell_cycle$Cell_cycle[cells], rownames(cell_cycle))

typed <- tibble::tibble(
  distance = c("euclidean", "manhattan"),
  matrix = list(
    as.matrix(stats::dist(cell_cycle)),
    as.matrix(stats::dist(cell_cycle, method = "manhattan"))
  ),
  type = "distance"
)

panels <- precise_viz(
  typed,
  views = c("heatmap", "embedding"),
  params = list(
    heatmap = list(cluster = TRUE, method = "complete"),
    embedding = list(method = "mds", color = groups, show_labels = TRUE)
  ),
  verbose = FALSE
)

panels[, c("panel_id", "input", "view", "input_type", "panel_class")]
#> # A tibble: 4 × 5
#>   panel_id             input     view      input_type panel_class
#>   <chr>                <chr>     <chr>     <chr>      <chr>
#> 1 euclidean__heatmap   euclidean heatmap   distance   ggplot2::ggplot
#> 2 euclidean__embedding euclidean embedding distance   ggplot2::ggplot
#> 3 manhattan__heatmap   manhattan heatmap   distance   ggplot2::ggplot
#> 4 manhattan__embedding manhattan embedding distance   ggplot2::ggplot

panels$panel[[1]]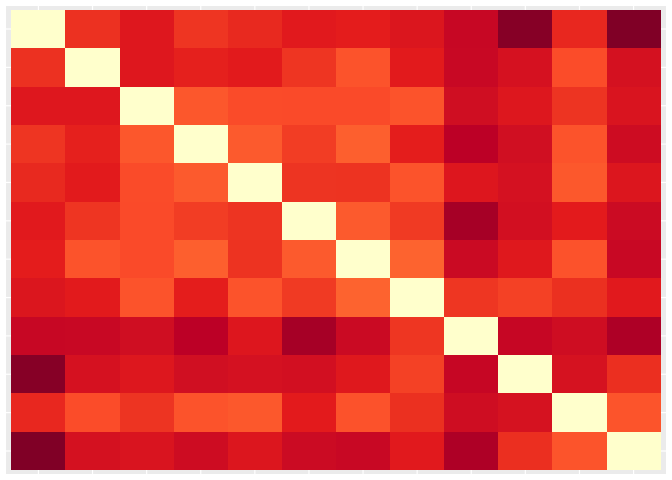
Ask for a similarity view on distance input and you get an error rather than a silent conversion:
precise_viz(typed, views = "graph_layout", verbose = FALSE)
#> Error: precise_viz(): view 'graph_layout' accepts similarity input but 'euclidean', 'manhattan' are distance-typed; supply compatible typed matrices or drop the view.
Working with PreciseDist
PreciseDist builds relatedness matrices, compares them, fuses them, and projects them into graphs. Its output is already in the shape PreciseViz accepts, so the two compose directly:
library(PreciseDist)
library(PreciseViz)

graph <- precise_dist(cell_cycle, dists = c("euclidean", "canberra"),
                      verbose = FALSE) |>
  precise_transform(to = "distance") |>
  precise_fusion(methods = "mean", verbose = FALSE) |>
  precise_graph(methods = "knn", params = list(knn = list(k = 3)),
                verbose = FALSE)

precise_viz(graph, views = "graph_layout", verbose = FALSE)
Neither package imports the other, and both ship the same data_cell_cycle data set so their examples stand on their own.
Installation
PreciseViz requires R >= 4.1.0. It is not yet on CRAN, so install the development version from the shared repository:
# install.packages("devtools")
devtools::install_github("bmuchmore/PreciseDist", subdir = "PreciseViz")
uwot is required for the default UMAP embedding. The interactive renderers are optional: plotly for interactive 2-D and 3-D panels, threejs for 3-D graphs and embeddings, visNetwork for interactive networks, Rtsne for t-SNE coordinates, and trelliscopejs for browsing.
Where to begin
The reference index documents all three functions, and the Visualizing Typed Matrices vignette walks through the views on hand-built matrices.