Visualizing Typed Matrices
Brian Muchmore
2026-08-13
Source:vignettes/Visualizing-Typed-Matrices.Rmd
Visualizing-Typed-Matrices.RmdPreciseViz consumes explicitly typed relatedness matrices. It does not require a particular producer or object class, and it never infers whether a matrix is a distance or similarity from its values.
A typed distance
Start with an ordinary square distance matrix. A typed collection stores the matrix in a list-column, gives it a unique key, and declares its type.
coordinates <- matrix(
  c(
    0.0, 0.0,
    0.4, 0.2,
    0.2, 0.7,
    2.8, 2.7,
    3.2, 2.9,
    2.9, 3.4
  ),
  ncol = 2,
  byrow = TRUE,
  dimnames = list(paste0("item_", 1:6), c("x", "y"))
)

distance_matrix <- as.matrix(stats::dist(coordinates))
distance_input <- tibble::tibble(
  distance = "example_distance",
  matrix = list(distance_matrix),
  type = "distance"
)
The heatmap and multidimensional-scaling embedding are both rendered with the default static ggplot2 engine. Parameters are explicit so the code also serves as a compact reference for the typed visualization interface.
distance_panels <- precise_viz(
  distance_input,
  views = c("heatmap", "embedding"),
  params = list(
    heatmap = list(
      cluster = TRUE,
      method = "complete",
      engine = "ggplot2"
    ),
    embedding = list(
      method = "mds",
      dimensions = 2,
      engine = "ggplot2",
      show_labels = TRUE
    )
  ),
  parallel = FALSE,
  verbose = FALSE
)

distance_panels[, c("panel_id", "input", "view", "input_type")]
#> # A tibble: 2 × 4
#>   panel_id                    input            view      input_type
#>   <chr>                       <chr>            <chr>     <chr>
#> 1 example_distance__heatmap   example_distance heatmap   distance
#> 2 example_distance__embedding example_distance embedding distance
distance_panels$panel[[1]]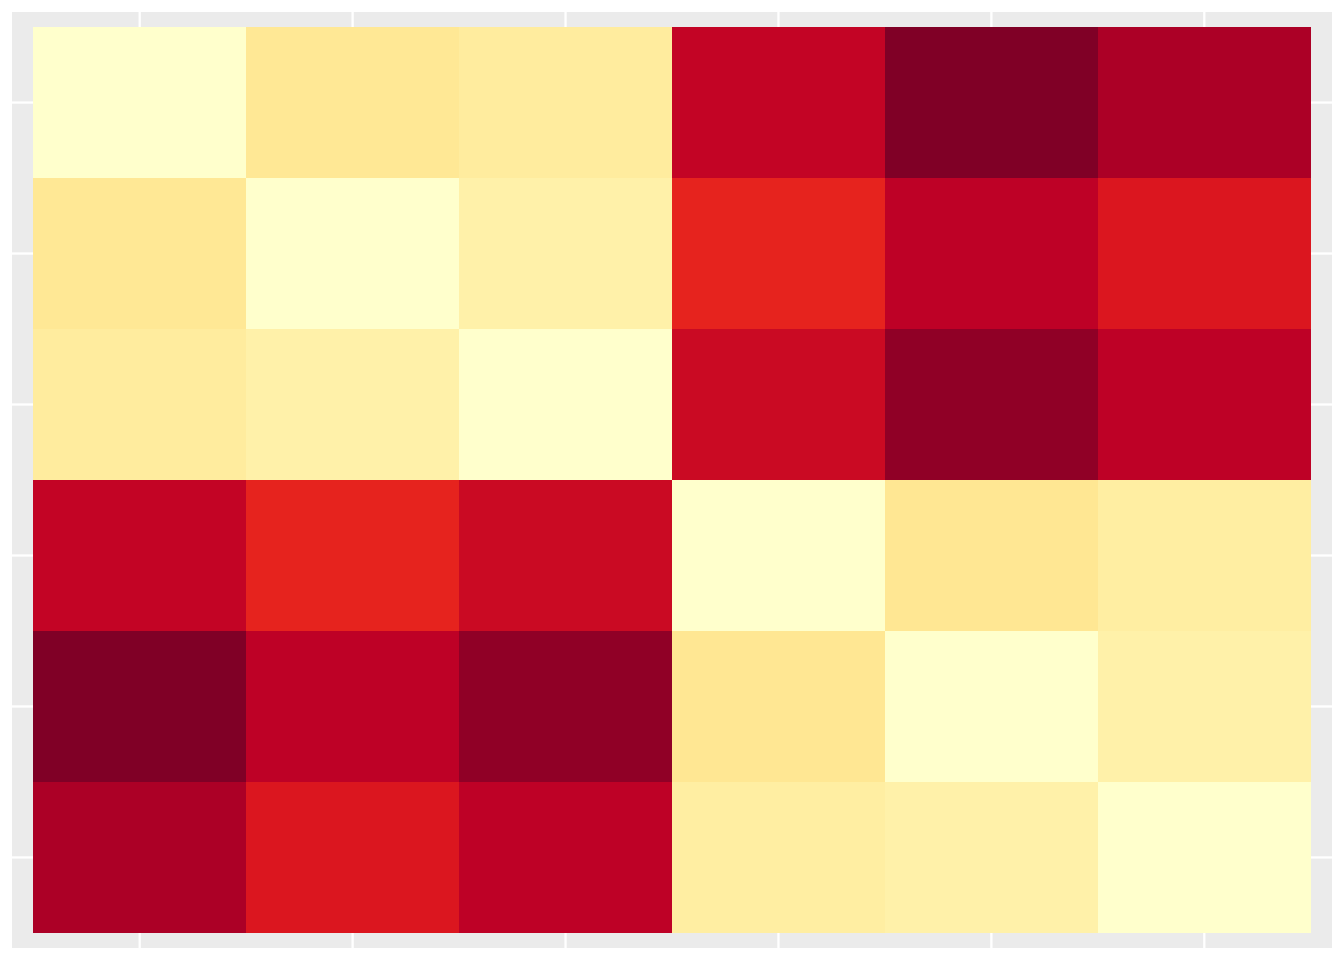
distance_panels$panel[[2]]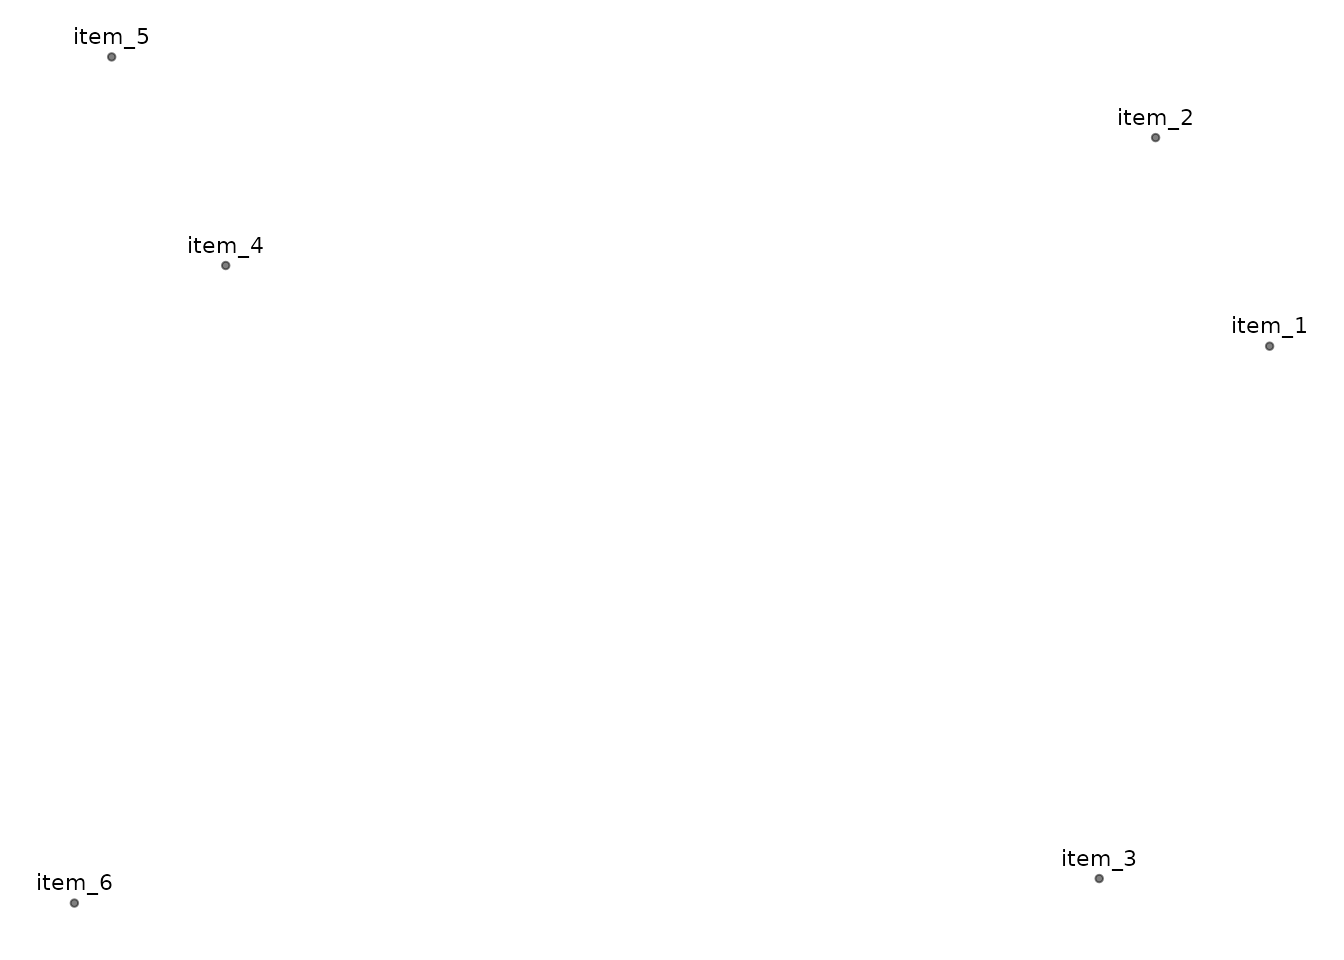
A typed graph similarity
Graph layouts require an explicitly declared similarity matrix. Here a simple weighted adjacency is constructed from the distance matrix, with its diagonal cleared so vertices do not carry self-edges.
graph_matrix <- exp(-distance_matrix)
diag(graph_matrix) <- 0

graph_input <- tibble::tibble(
  distance = "example_graph",
  matrix = list(graph_matrix),
  type = "similarity"
)

graph_panel <- precise_viz(
  graph_input,
  views = "graph_layout",
  params = list(
    graph_layout = list(
      layout = "mds",
      dimensions = 2,
      engine = "ggplot2",
      render = "graph",
      show_labels = TRUE
    )
  ),
  parallel = FALSE,
  verbose = FALSE
)

graph_panel$panel[[1]]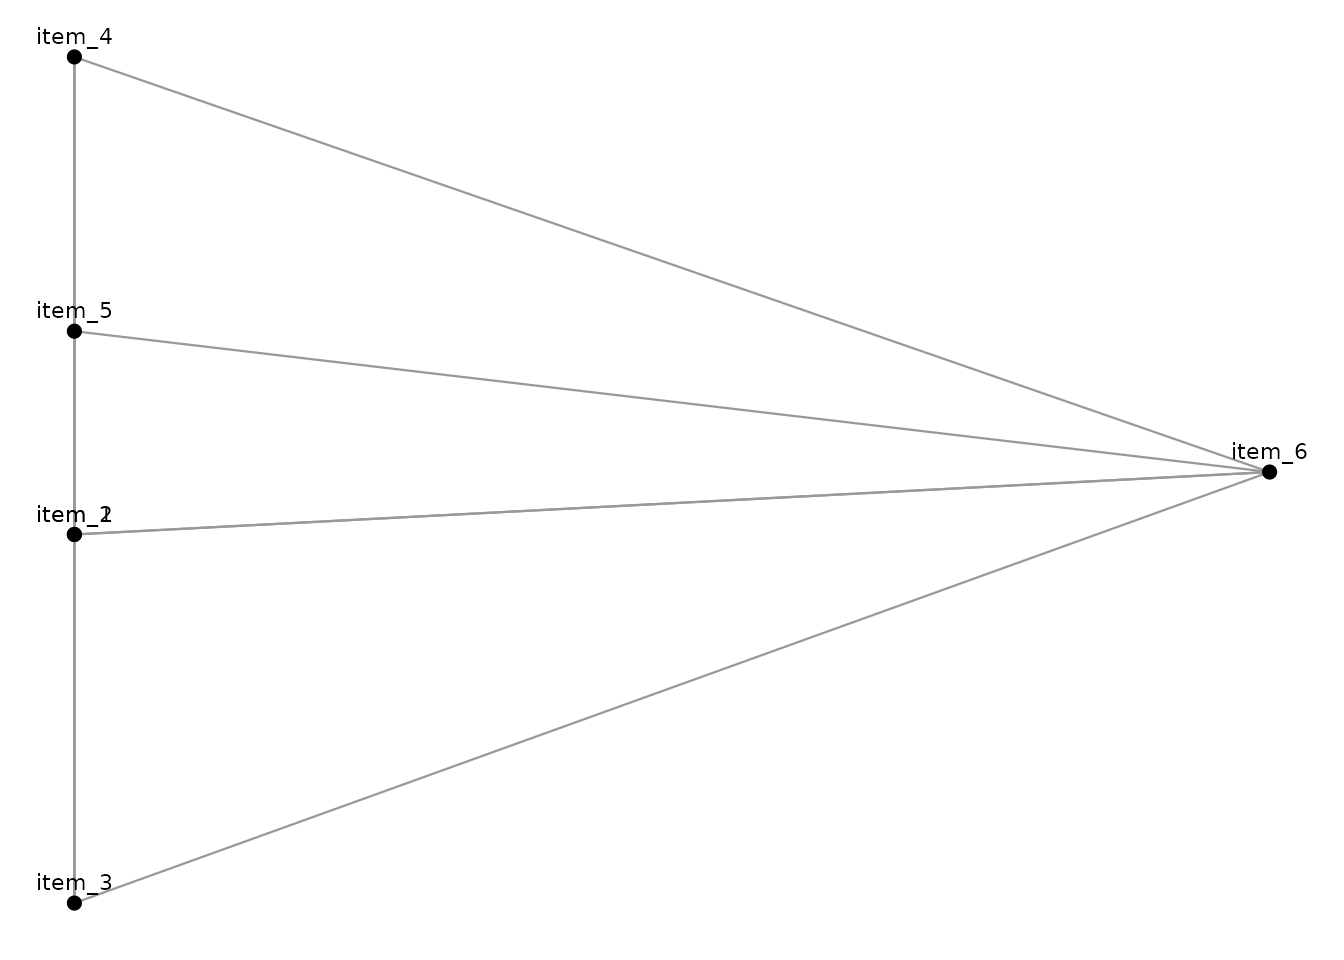
The same typed inputs can be rendered with optional interactive engines when their suggested packages are installed. Those engines change presentation, not the matrix type or values supplied to PreciseViz.